King’s College London is one of the UK’s most prestigious universities. Their long-standing commitment to employee experience is underpinned by a genuine drive to listen to employees and respond with meaningful change.
King’s are continually looking for ways and means to improve work–life for their people, ensuring they feel supported, heard and passionate about their work. Since partnering with People Insight, King’s College have gone from strength to strength, creating a clear employee experience strategy with a long-term impact, underpinned by our employee survey platform.
However, listening to employees and gathering data is one thing. What actually matters is what you do with these insights.
You might also enjoy: King’s College London: A new era of engagement
King’s College understands that the success of a survey isn’t measured only by response rates or scores. It’s about what happens next.
Employees want to see their feedback taken seriously. Managers want guidance they can trust. And organisations want to show progress over time. But without effective communication, the connection between data and action can break down.
With this in mind, we worked closely with King’s to align survey communications, dashboards and internal resources. The goal was to create a joined-up experience where managers felt supported, employees felt heard and results were translated into clear, achievable steps.
King’s latest pulse survey aimed to support managers across the organisation in identifying opportunities, having better conversations and driving improvements across their teams.
But with a new survey platform and updated dashboard features, managers needed help navigating the results. Some were returning to survey data after a long gap, while others were engaging with an employee survey platform for the first time.
King’s needed a simple, clear and visually engaging guide to help managers:
To bridge this gap, our dedicated survey Communications team created a bespoke, step-by-step guide designed to help King’s managers confidently explore their results, take meaningful action and continue building engagement in their teams.
The guide was practical, focused and fully aligned with the survey dashboard. It walked users through key actions, like viewing year-on-year comparisons, updating action plans and preparing for follow-up conversations.
We knew that if we got this right, it would remove uncertainty and encourage consistency in how results were used across departments.
Our approach to this PDF guide was collaborative from the start. Working closely with the King’s College People & Culture team, our survey consultants refined every detail of the guide to ensure it met the needs of managers and aligned with the university’s goals.
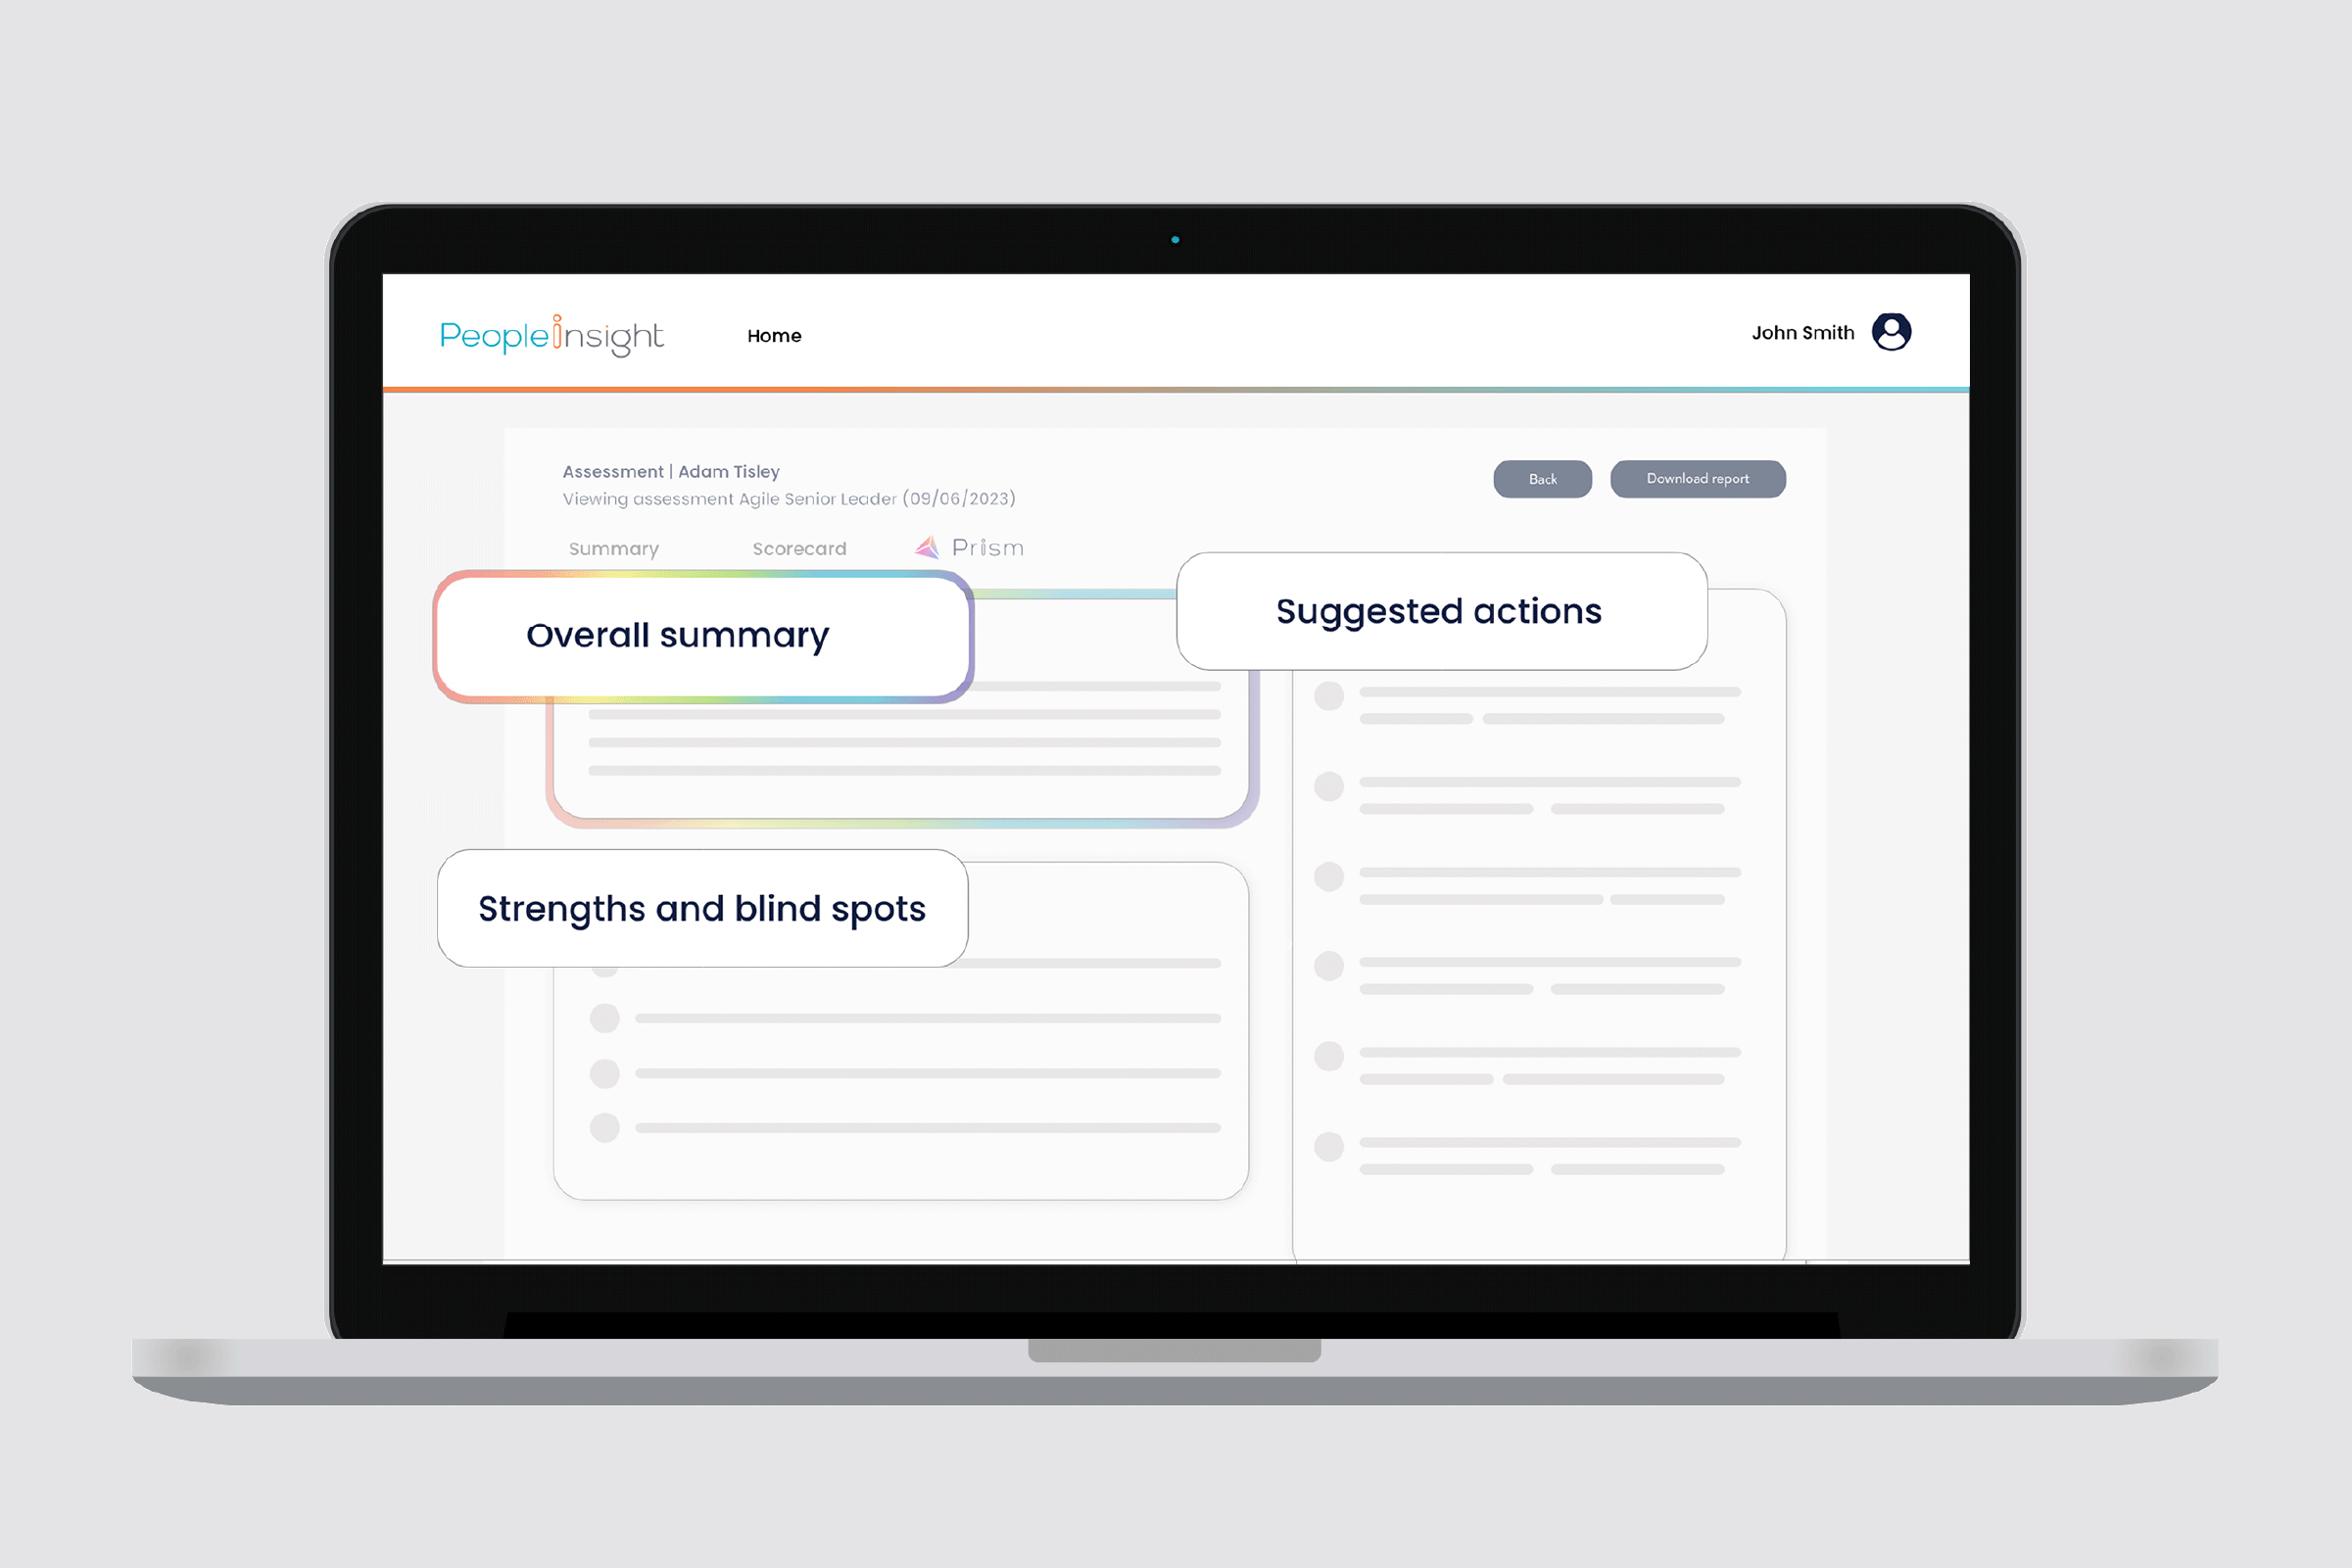
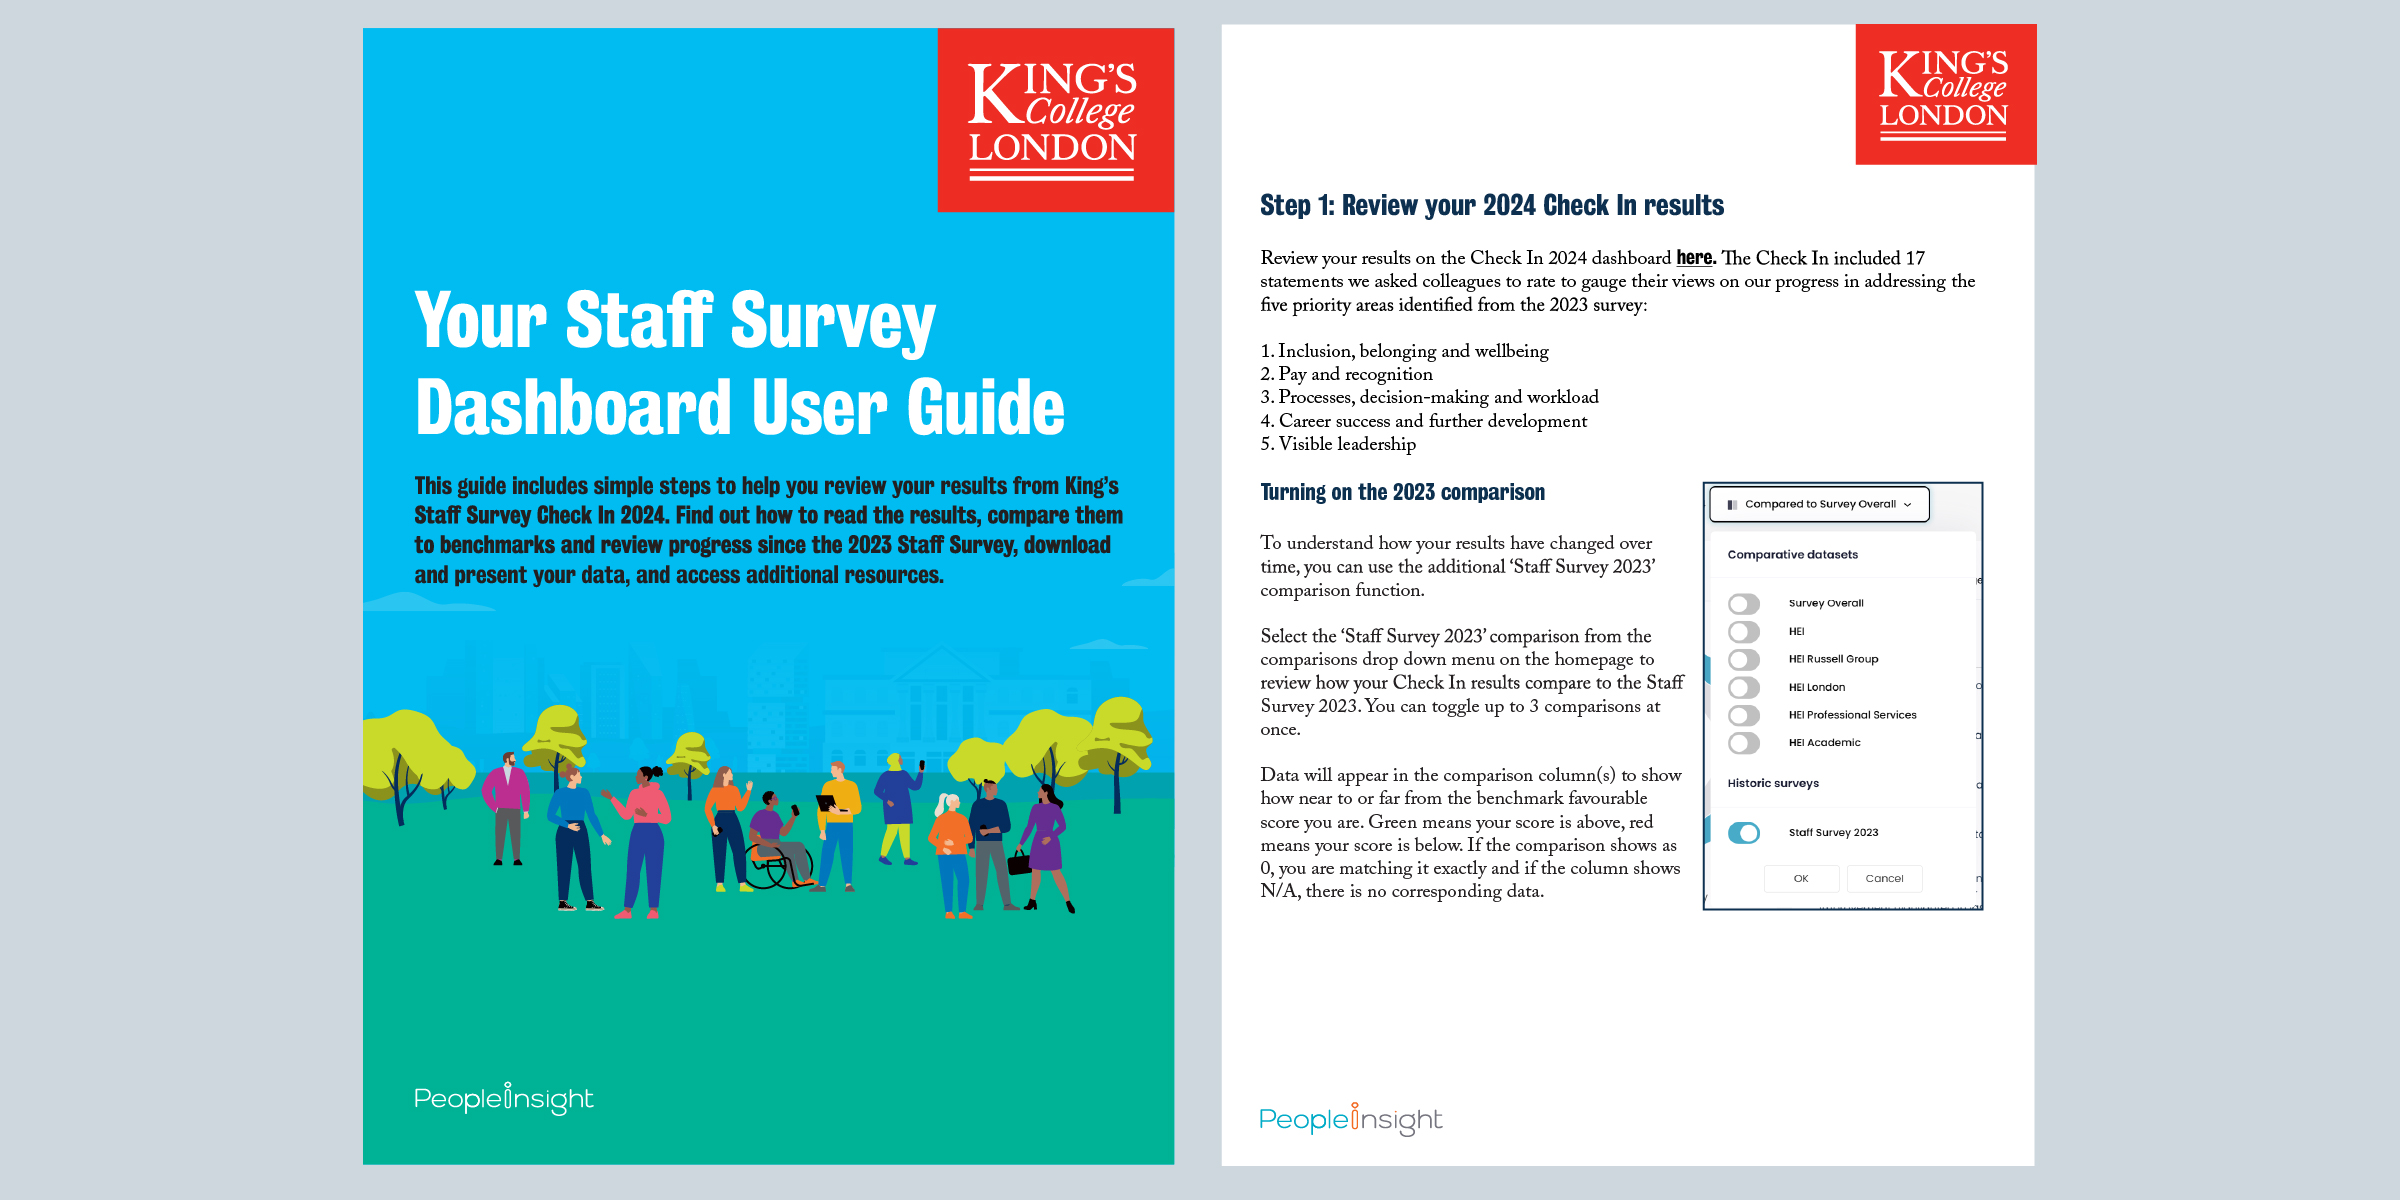
We started by drafting clear, plain-English instructions alongside annotated screenshots. This helped managers understand how to interact with their new dashboard, how to compare new and historic data and how to manage their action plans.
We then designed a clean, intuitive layout. Colour highlights were used to draw attention to key actions, icons helped break up the text and content was broken into bite-sized sections for easy scanning.
The guide went through several review rounds with King’s stakeholders to fine-tune both language and visuals. Each version brought us closer to a guide that felt practical, trustworthy and easy to follow.
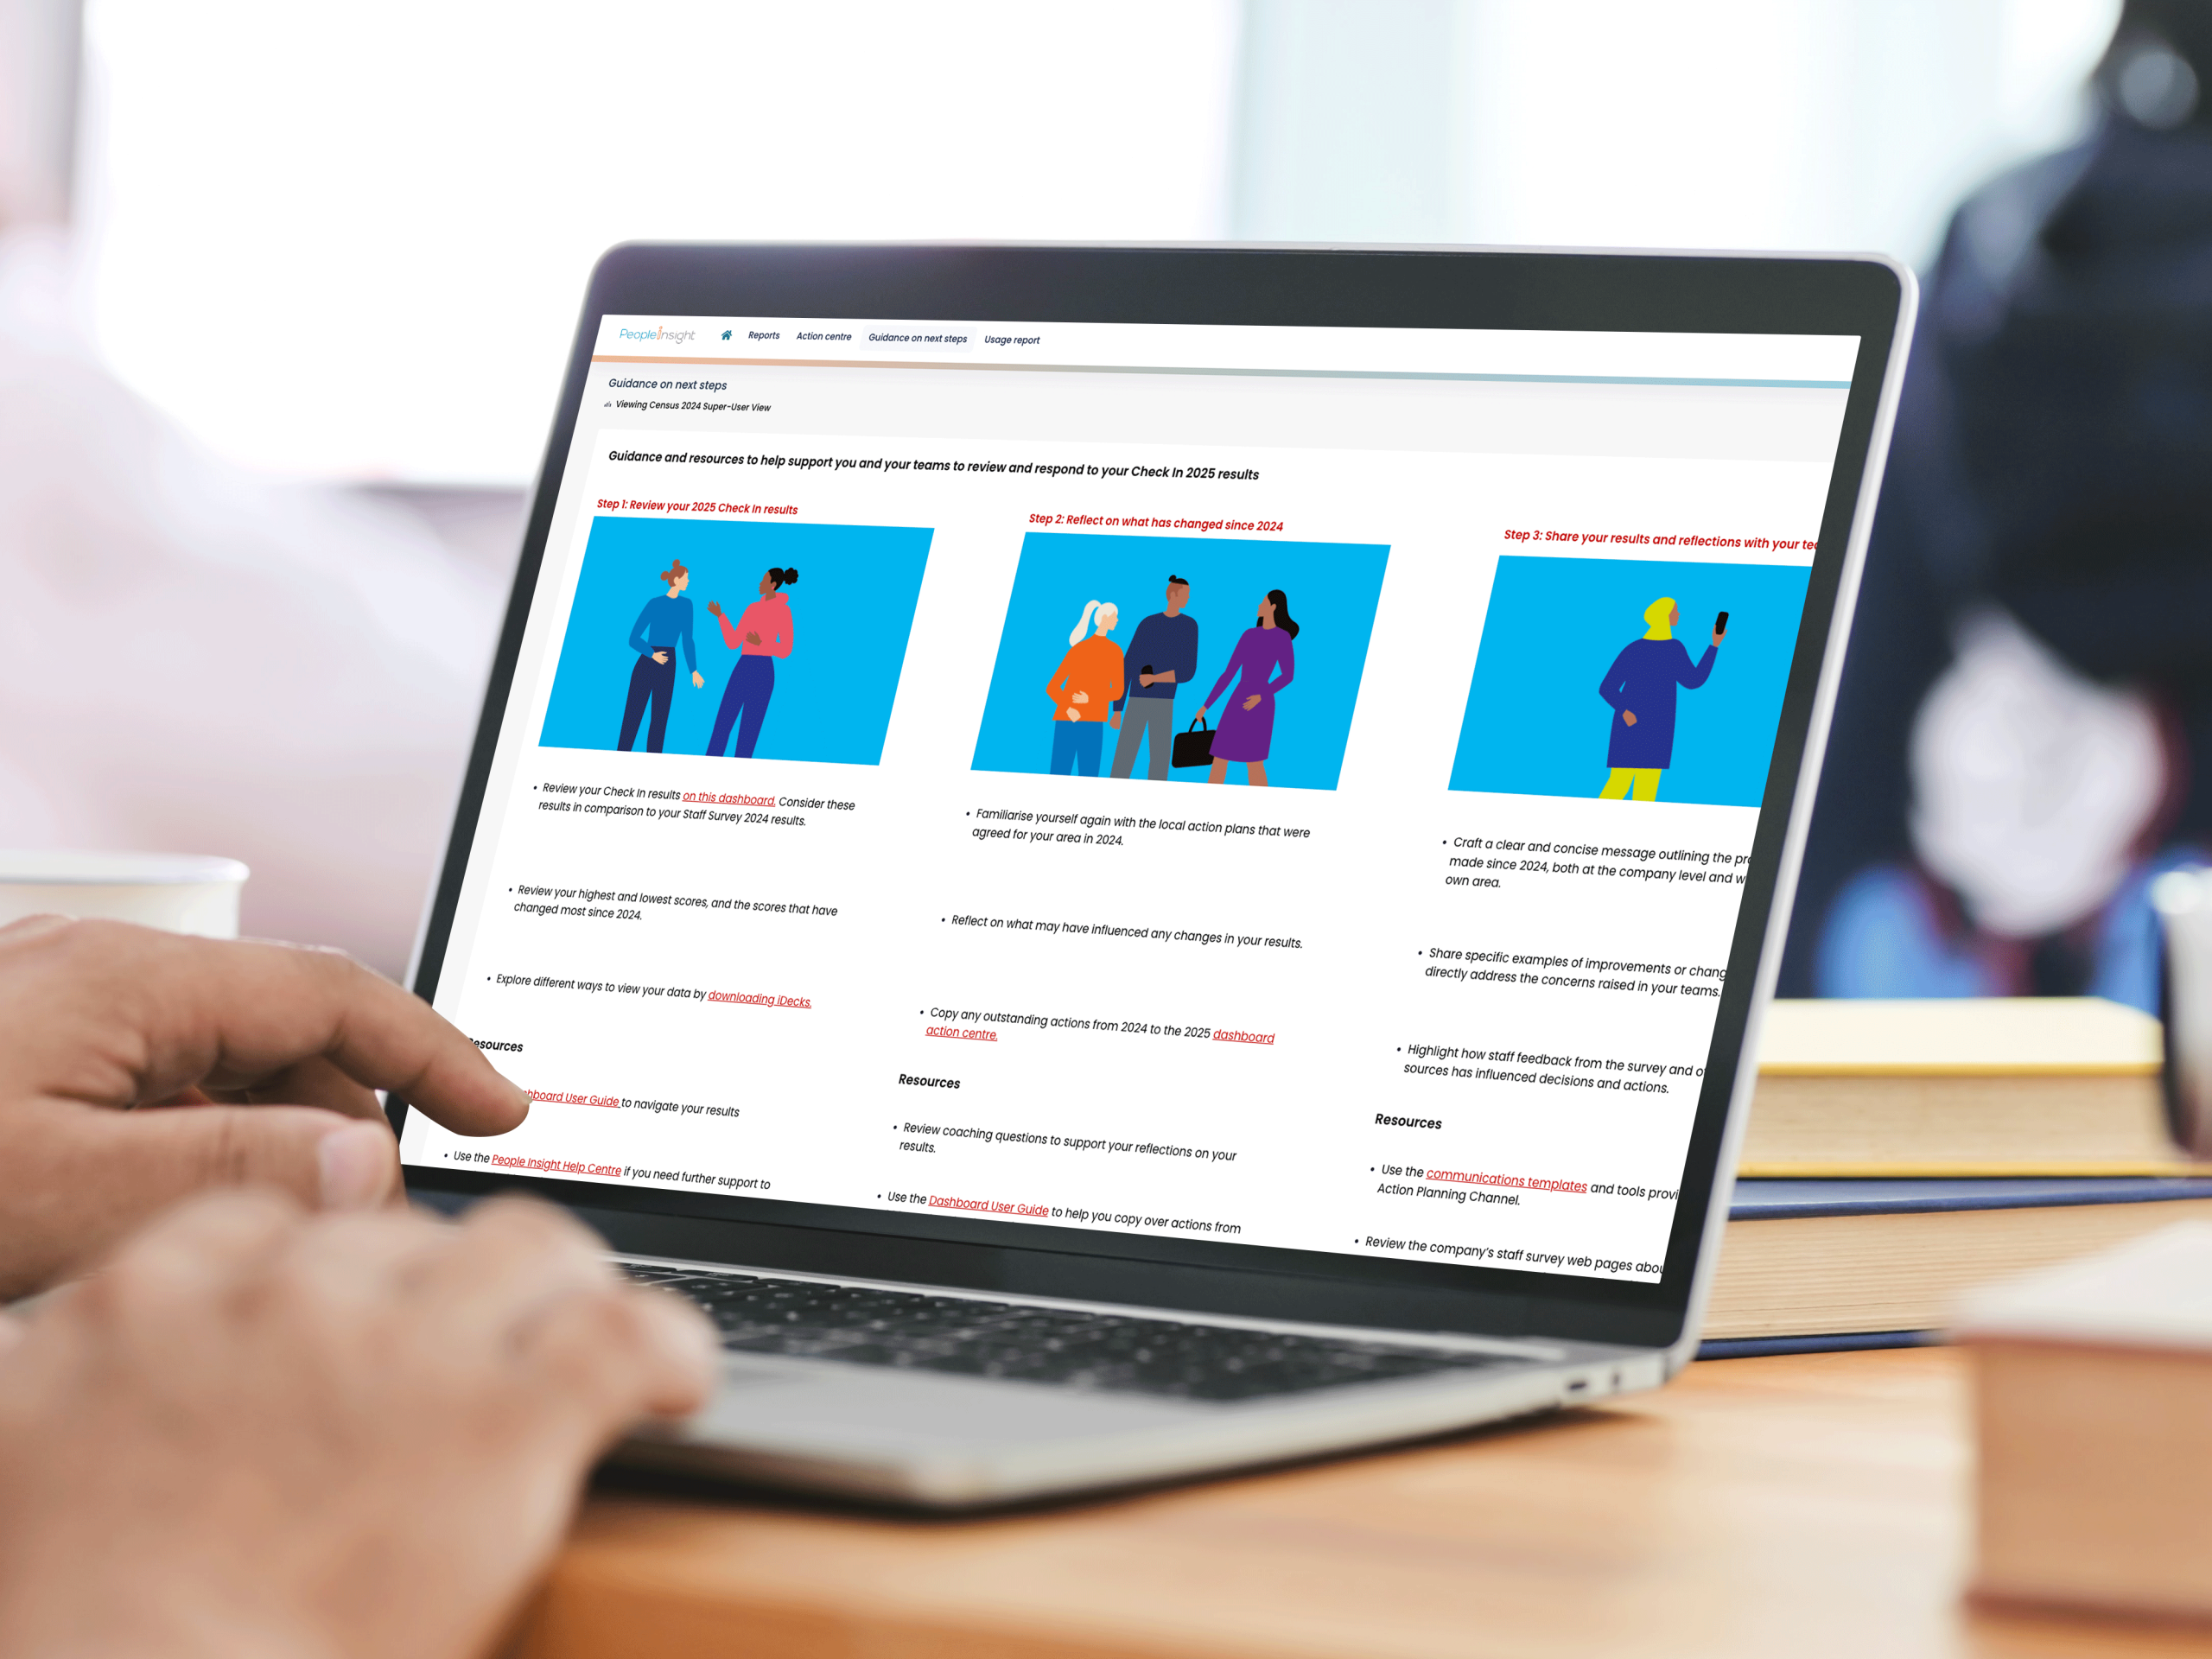
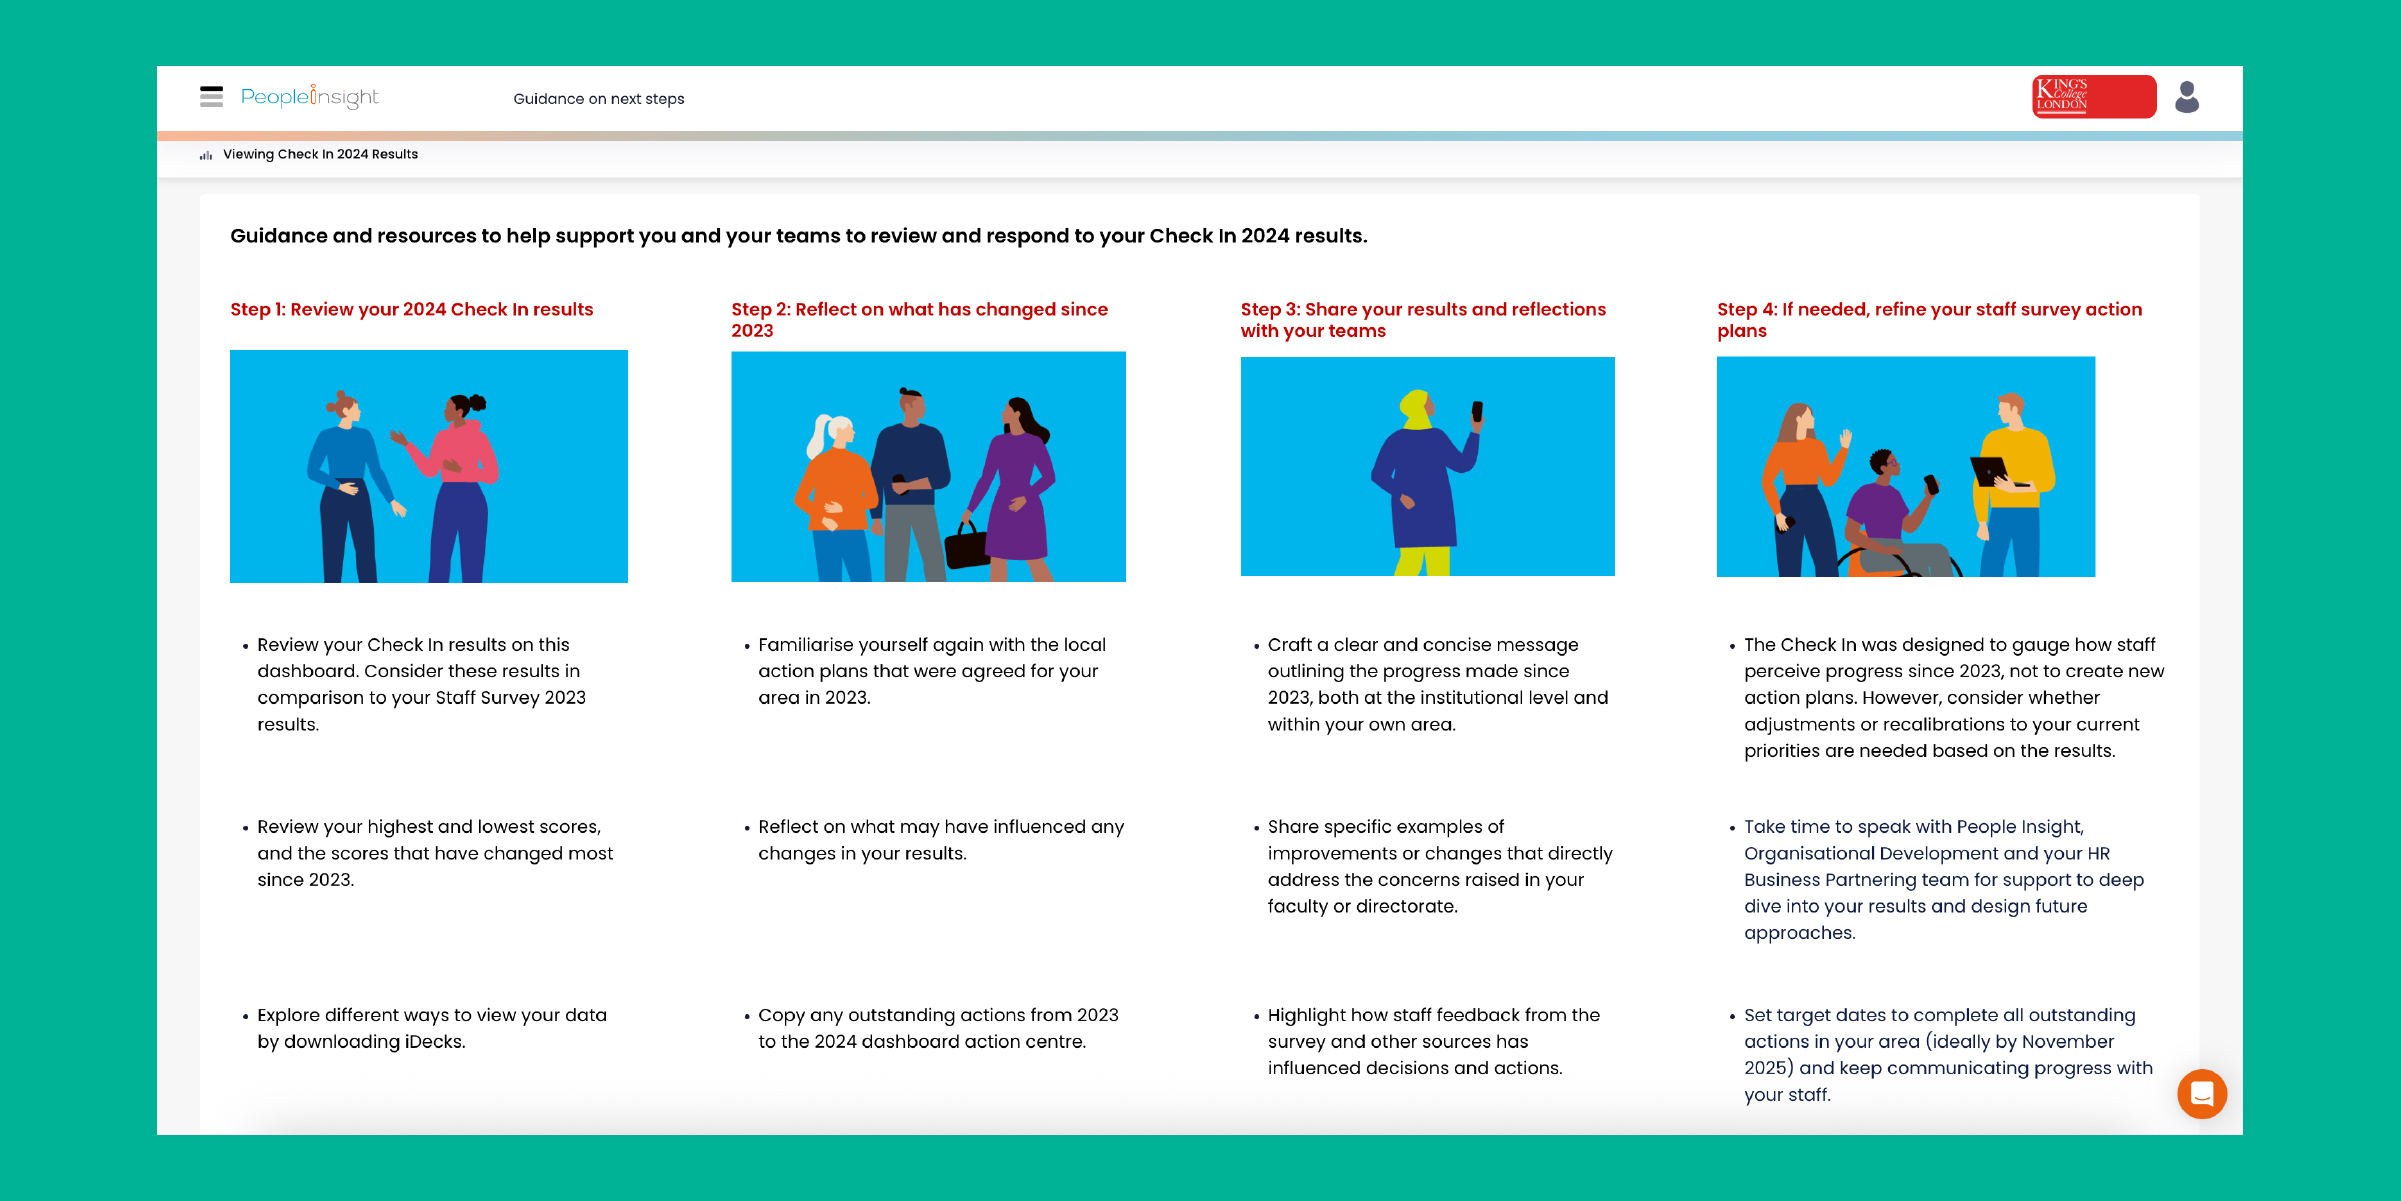
Alongside the PDF guide, we also built an easy and convenient “Guidance on next steps” page directly into the King’s survey dashboard. This linked to extra resources, templates and support tools, offering managers everything they needed in one place.
At the centre of the support toolkit is the three-step guide, designed to give every manager a clear route from insight to action.
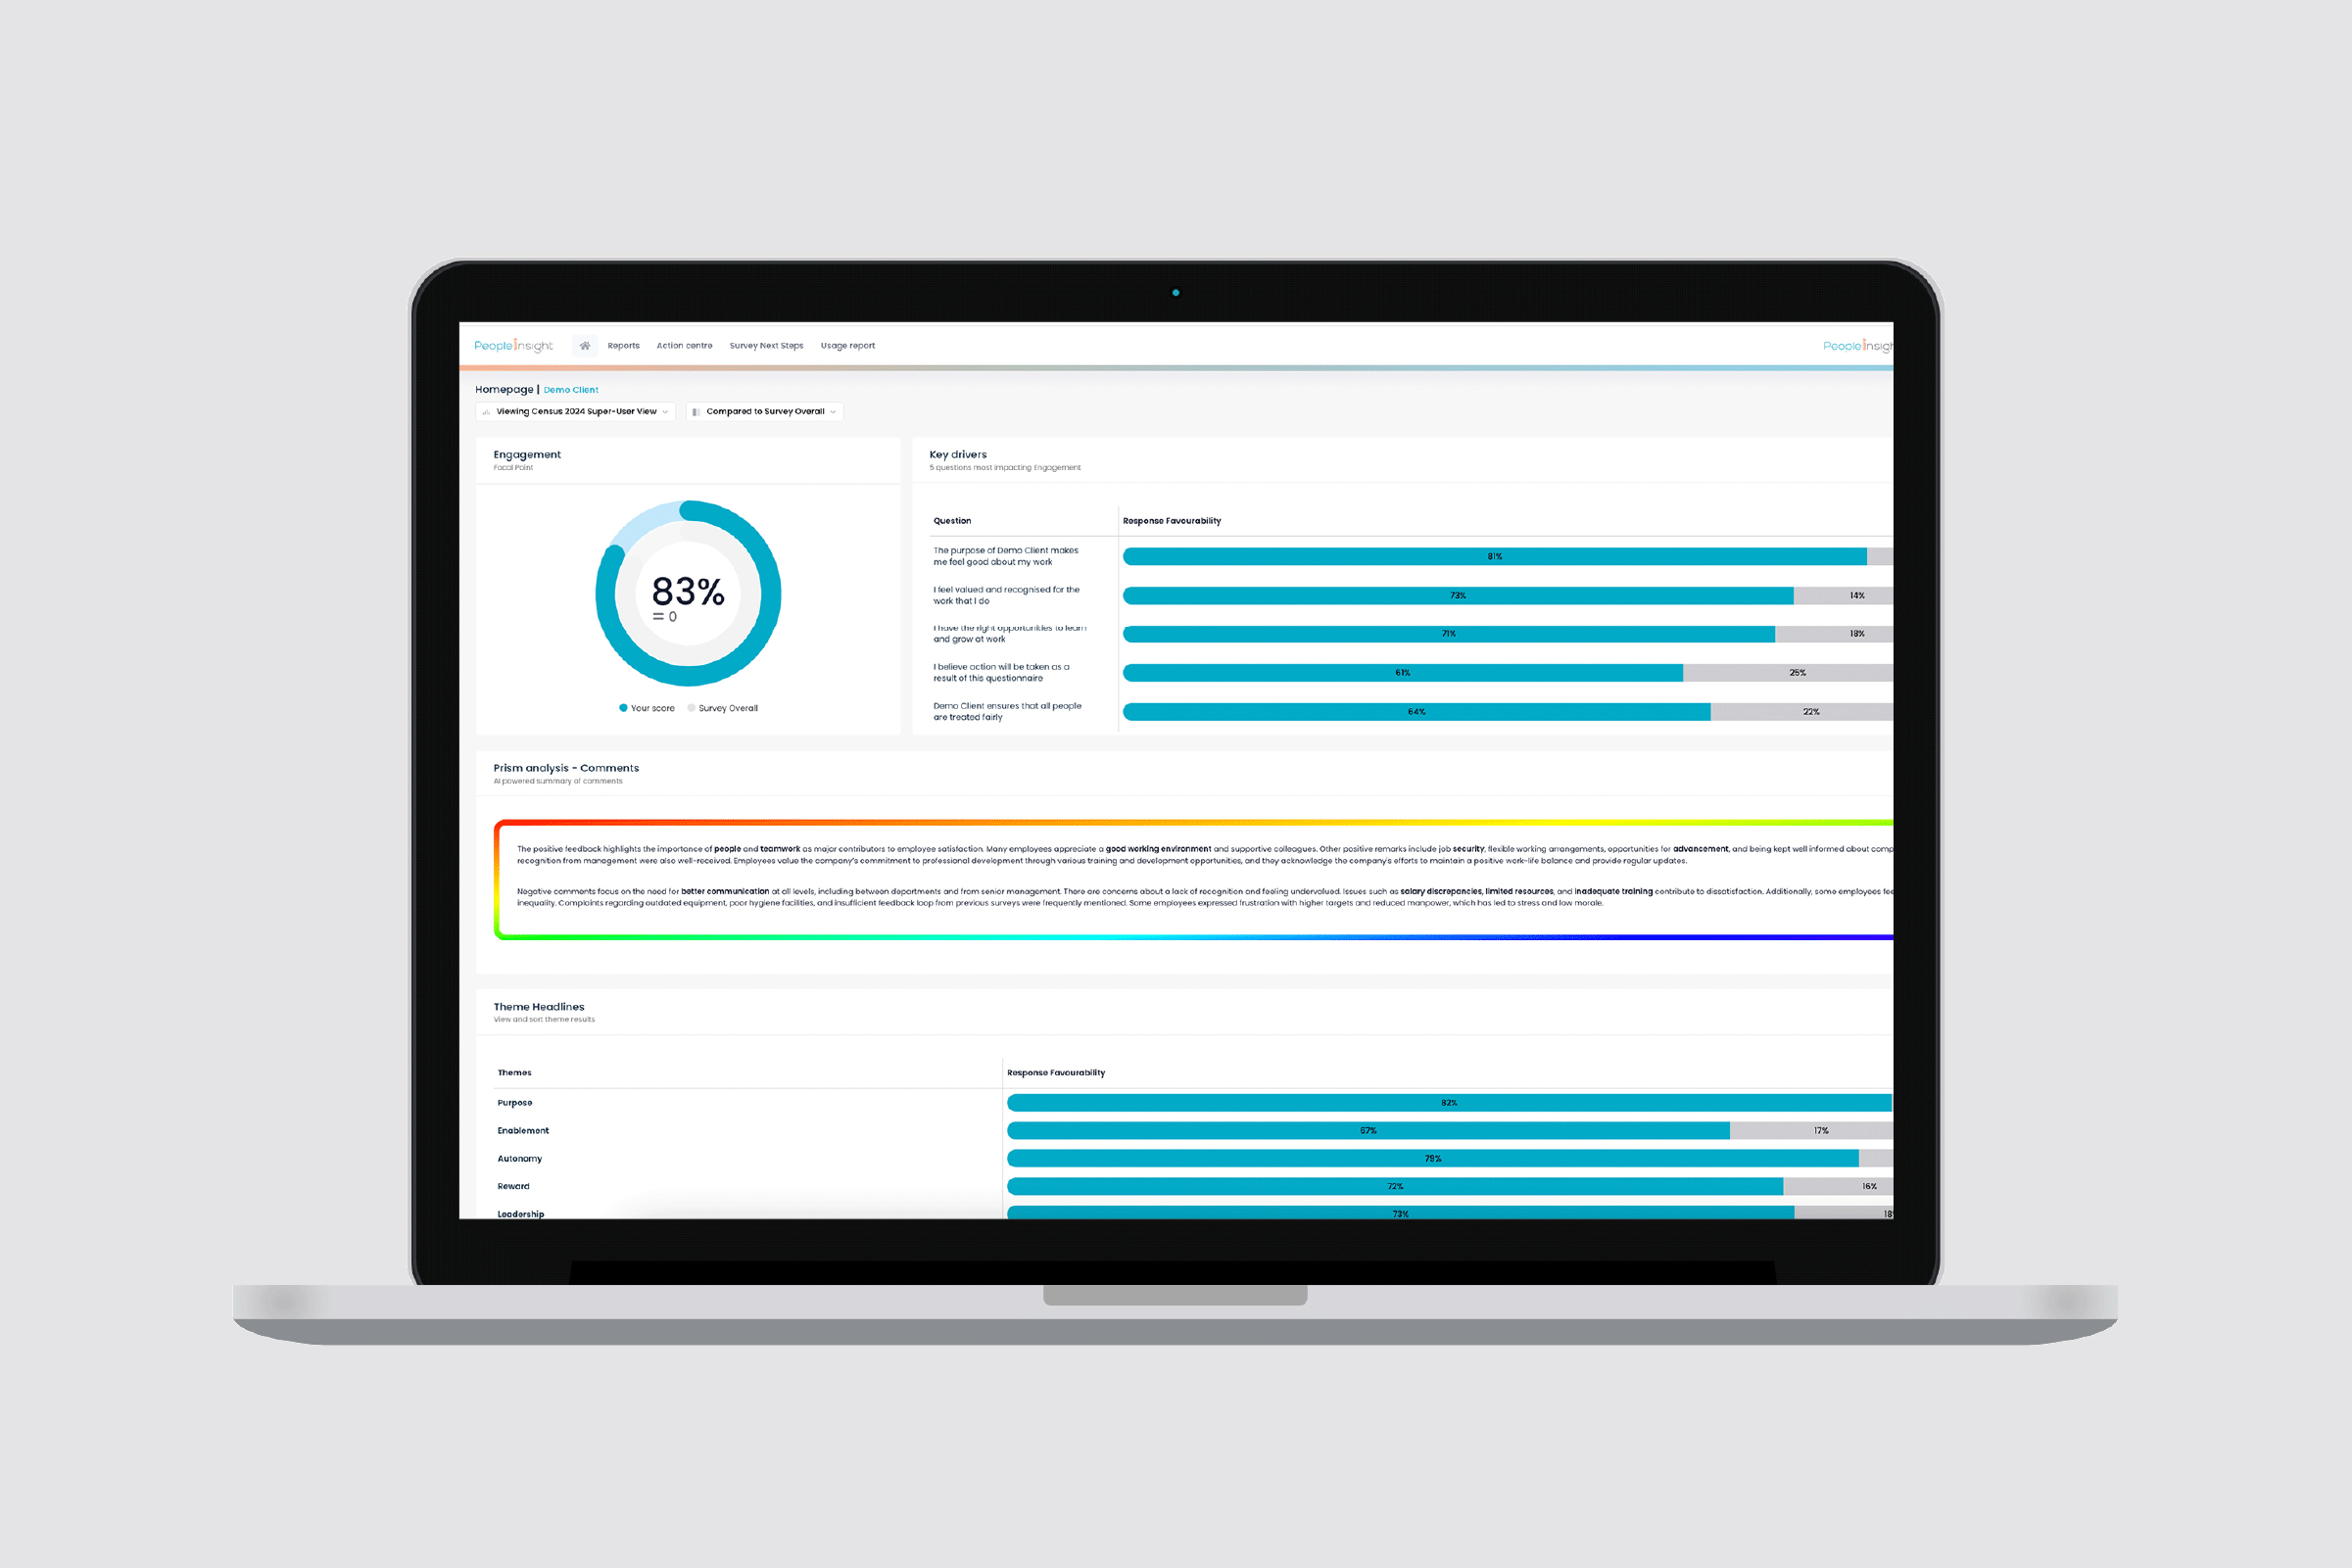
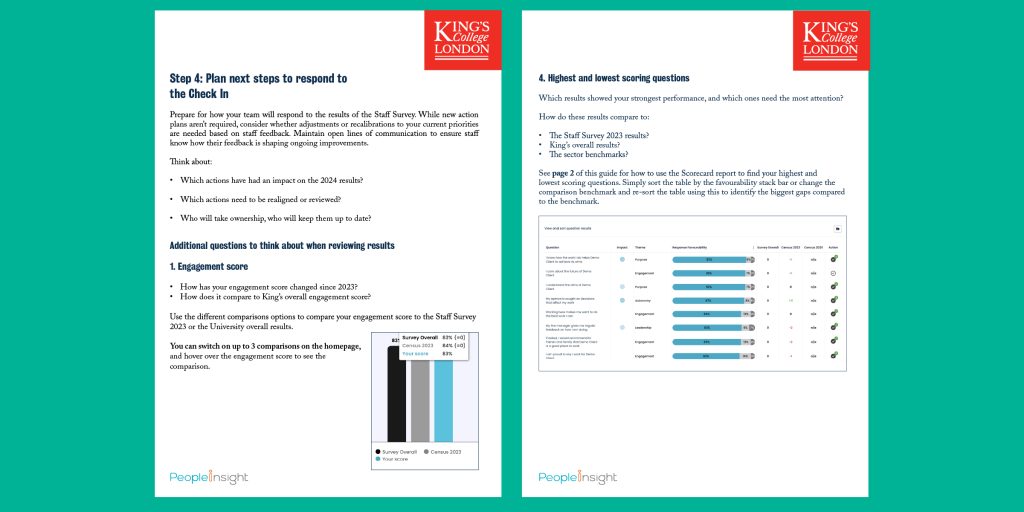
Step 1 instructed users on how to easily toggle to the historic survey comparison view, allowing them to see this year’s results side-by-side with last year’s scores. This made it simple to spot changes over time and identify any trends. The guide also explained how to quickly sort responses to highlight the three highest and three lowest scoring areas, helping managers focus on what’s working well and where the most attention might be needed.
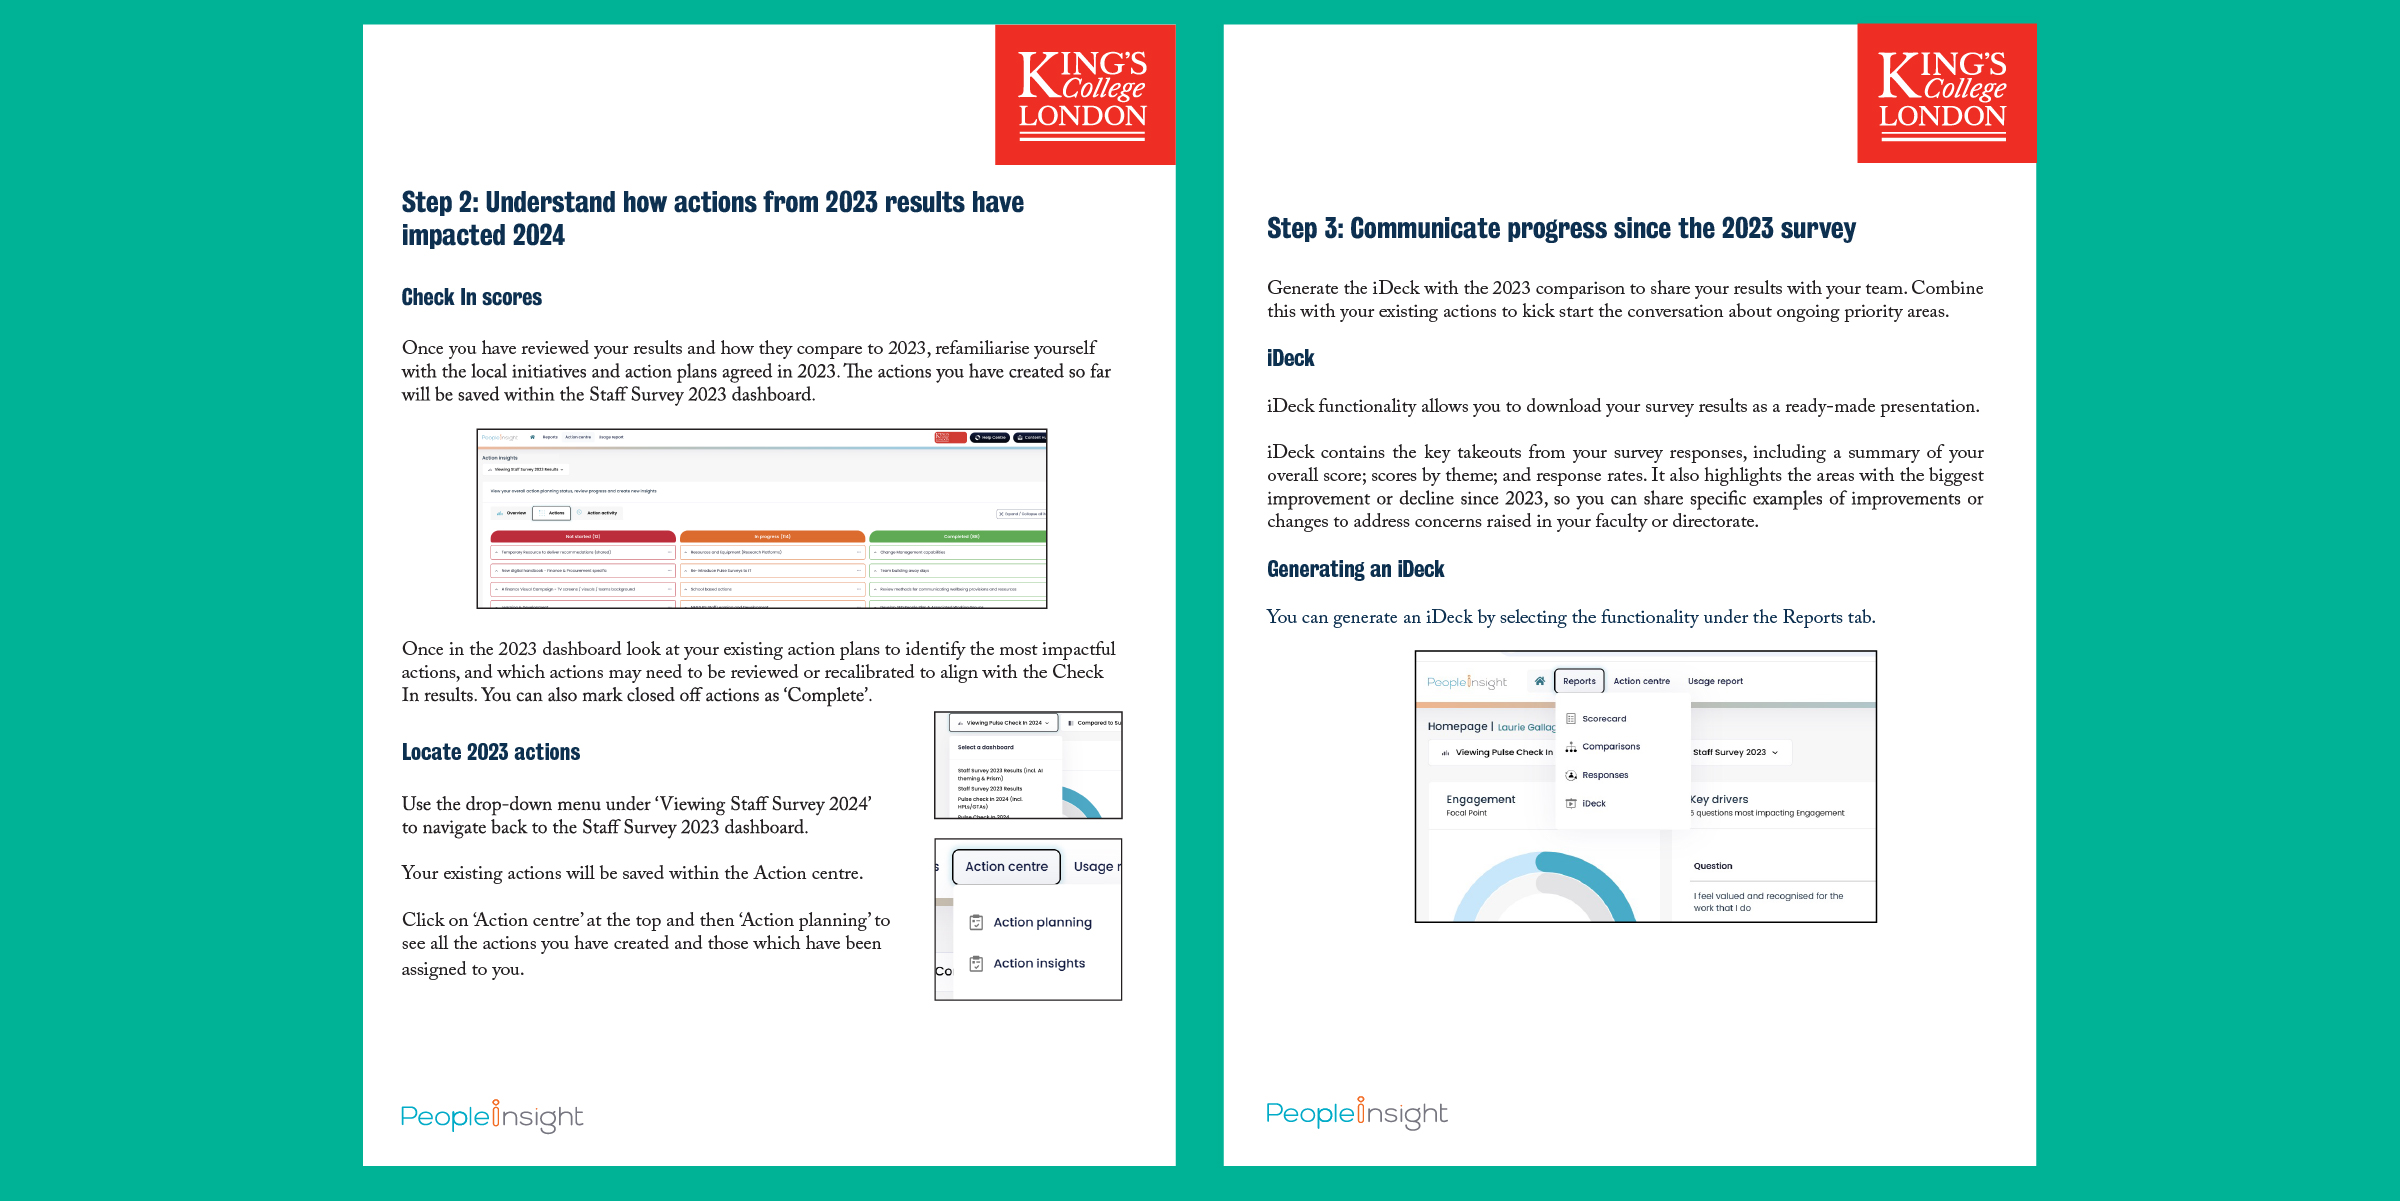
From there, managers were guided to review any existing action plans from previous surveys, with clear instructions on how to carry over relevant actions to the current dashboard, mark completed items or add new ones if appropriate.
This step laid the groundwork for thoughtful reflection and confident navigation of the survey platform.
Next, the guide helped managers interpret their results in context and decide where to focus. It encouraged them to take a moment to recognise areas that had improved and to dig deeper into those that had declined or remained static.
The instructions highlighted how to explore overall engagement scores, demographic insights and the top and bottom scoring questions. The guide also included prompts taken from the HR Business Partner presentation, designed to get managers thinking more critically about their data. This included questions like:
This step aimed to give managers a clearer sense of direction and prepare them for more meaningful reflection and discussion.
This very important step focused on sharing results with employees in an open and constructive way.
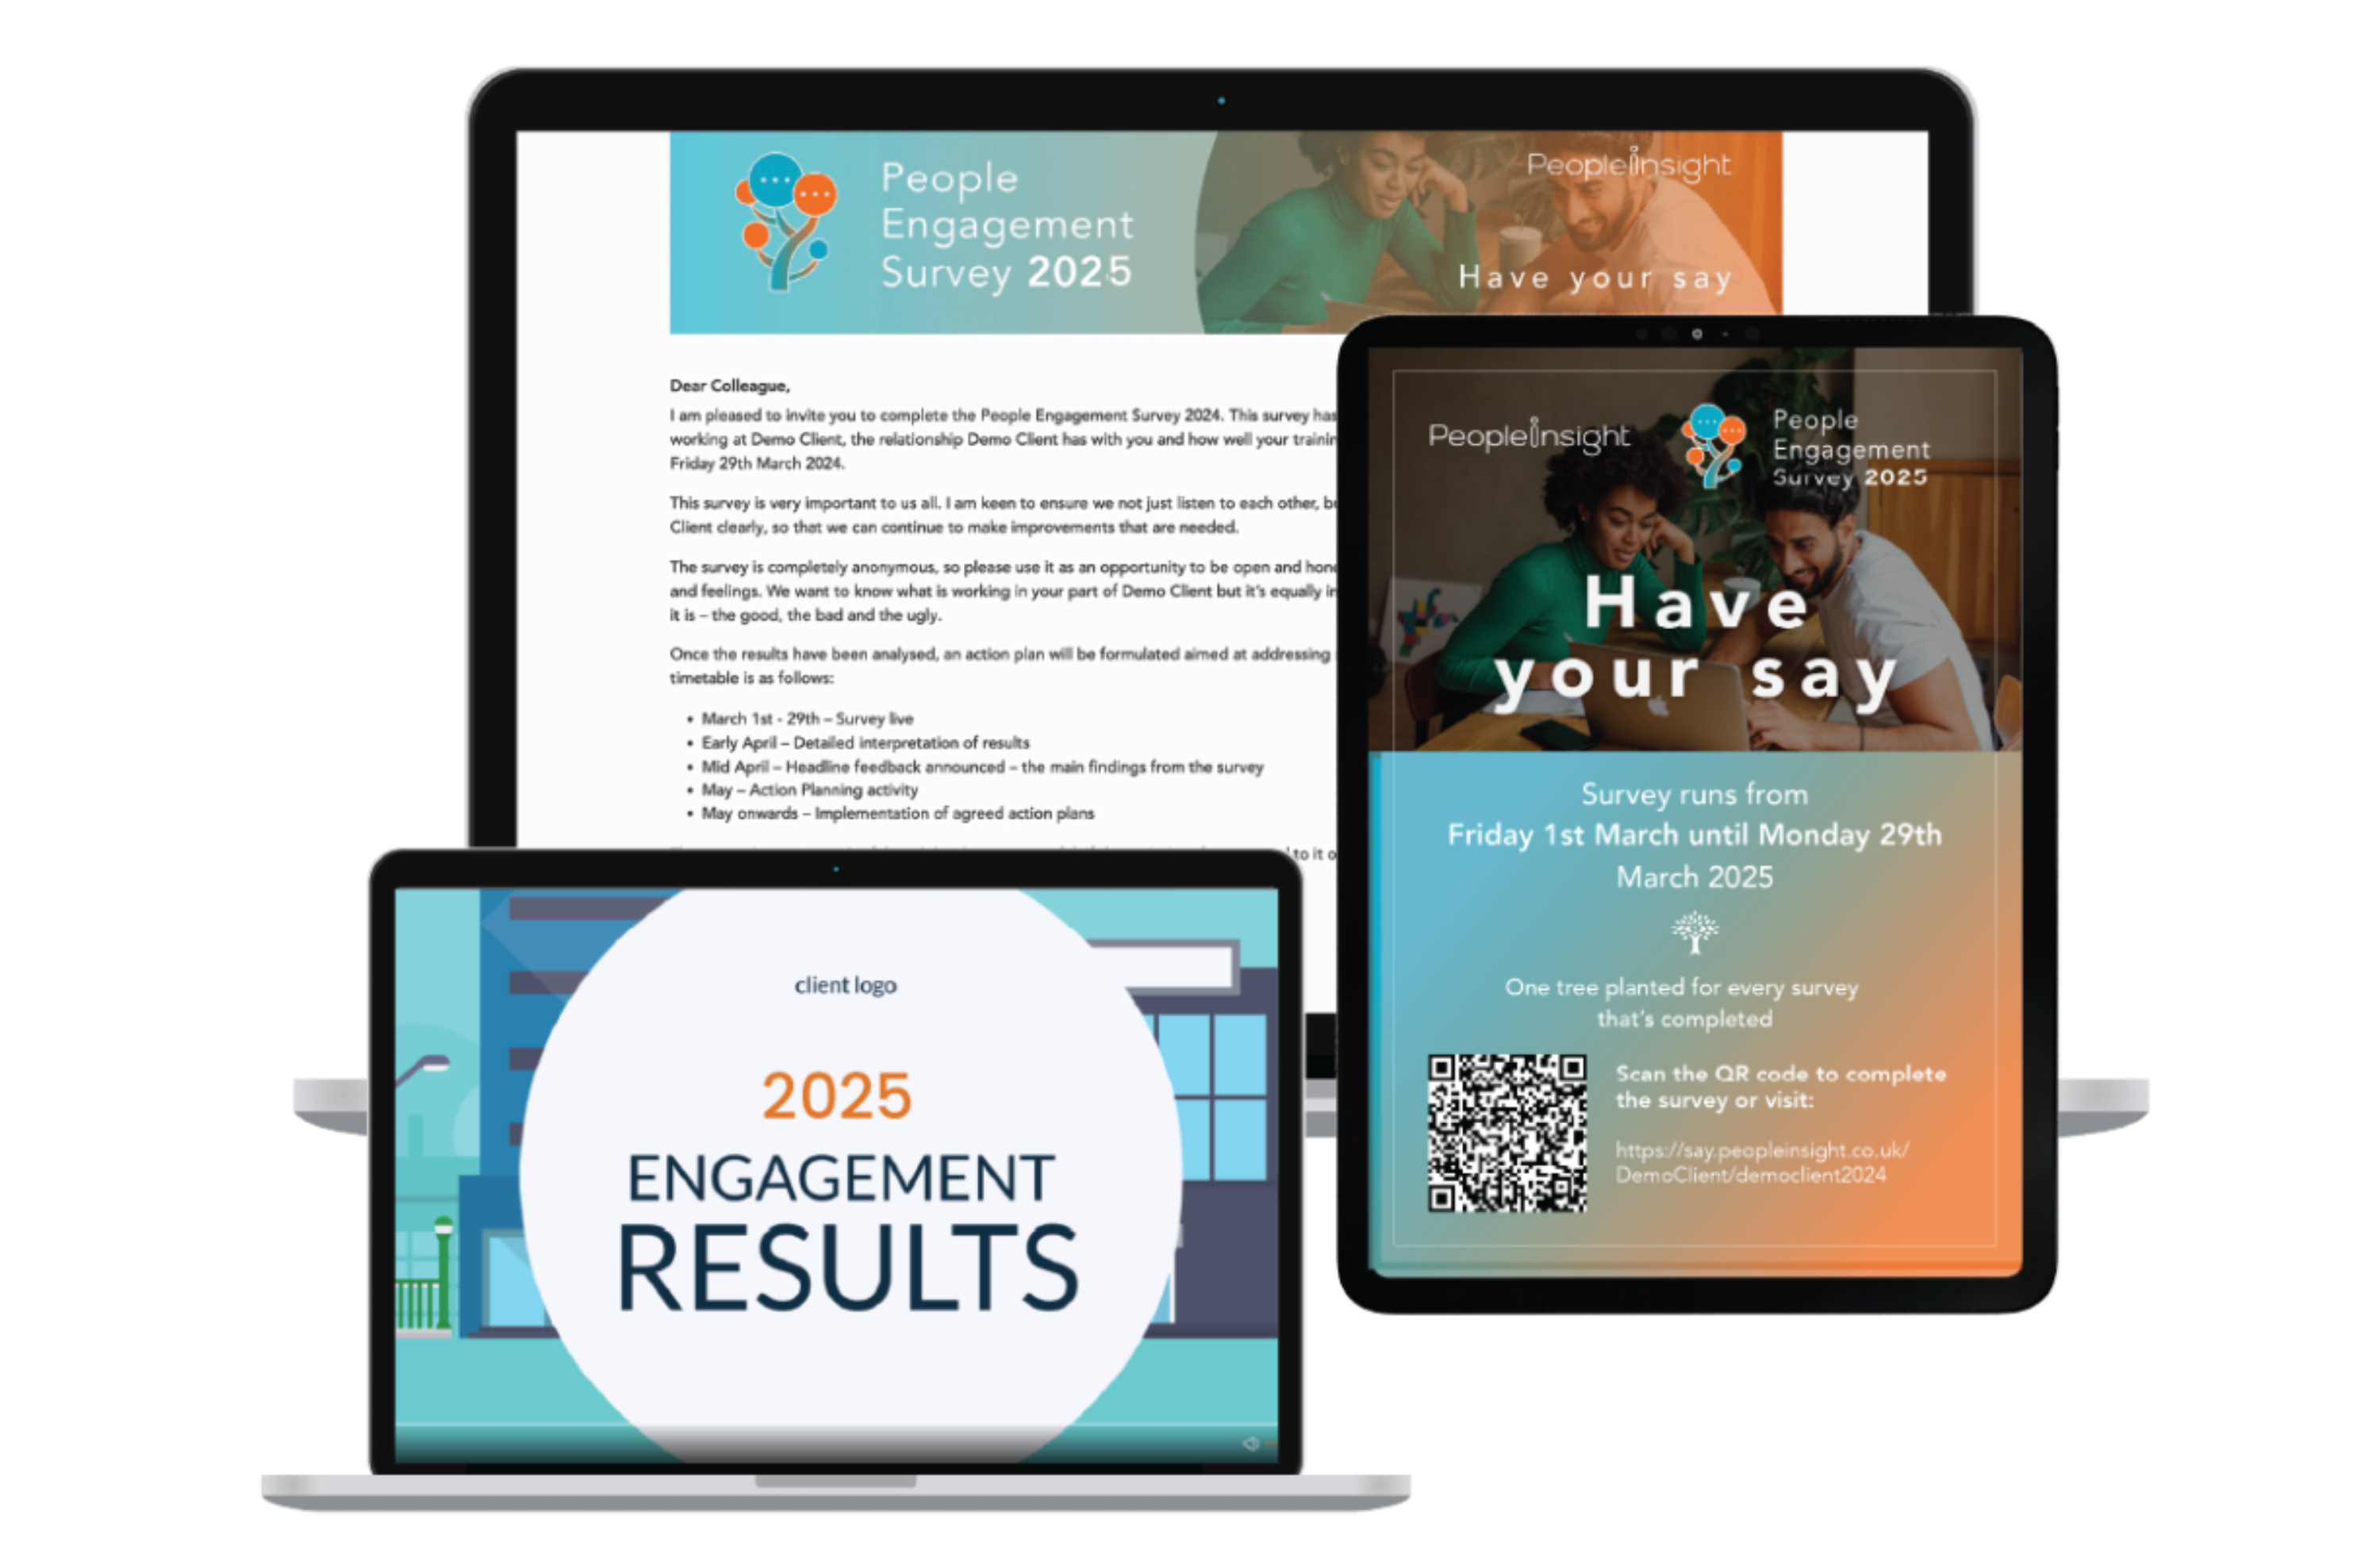
The guide walked managers through how to use the survey communication templates created by King’s to update their teams, making it easier to deliver a consistent message across the university. It also encouraged managers to use the new infographic to help visualise the results and keep things clear and engaging. To provide extra support, the guide pointed to opportunities to book a one-to-one session with a People Insight consultant for more tailored advice.
Finally, this step reminded managers to clearly outline what would happen next, whether that involved following up on specific actions, planning future surveys or continuing the conversation in team meetings. This final stage brought the process full circle and helped managers close the feedback loop with clarity and confidence.
This three-step approach made survey results feel less abstract and more actionable. Managers could quickly spot trends, consider next steps and start conversations with more confidence and enthusiasm.
The guide was positively received across the King’s People & Culture team, with feedback highlighting its clarity, tone and ease of use. Managers appreciated the clear layout and practical tips, while internal teams valued the consistency across PDF, dashboard and presentations.
Importantly, the guide helped to demystify the survey process and gave managers a framework to follow, regardless of their previous experience with survey results.
By making results easier to understand and act on, King’s is already seeing a more confident and engaged management community.
This is just the start of a refreshed approach to employee engagement at King’s.
With a more structured platform in place, the university now has the ability to track change over time, compare across departments and support managers in a consistent way.
Moving forward, King’s plans to continue building engagement momentum by:
By building these habits now, they’re laying the foundation for long-term improvement.
If you’re working in higher education and want to strengthen engagement across your organisation, now is the perfect time to act. Ask about how to get started with a higher education staff survey.
Our employee survey platform, communications expertise and hands-on support can help you build a survey strategy that delivers more than just data. We’ll help you get actionable feedback, make real progress and support your managers every step of the way.
Get in touch to discuss how our comms team can help you create a guide that makes survey results easier to understand and more impactful than ever before.